Test an AI forecast on the months you already closed
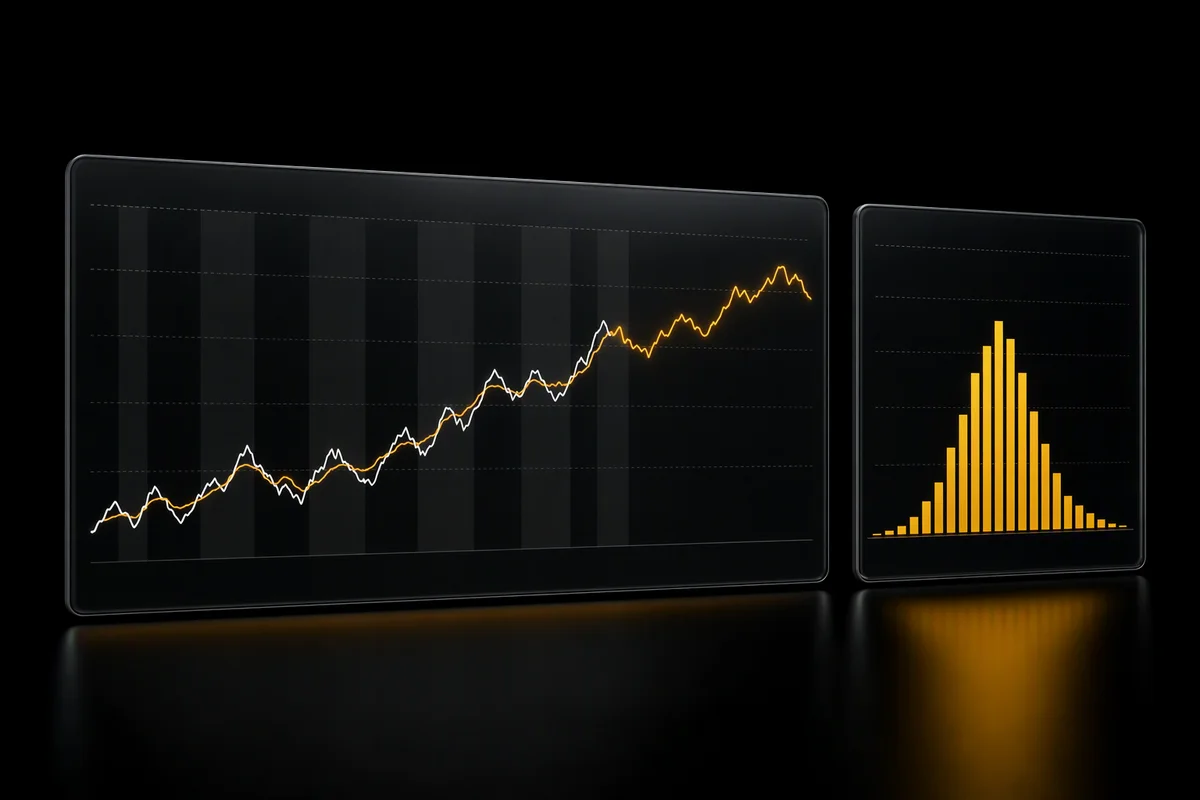
The demo was convincing. The vendor loaded twelve months of sales history, the model produced a forecast for the next quarter, and the curve looked smooth and sensible. Someone asked how accurate it was. The answer was a single, impressively low percentage — computed on data the model had already seen.
Three months later the forecast is further off than the spreadsheet it replaced. Nobody can say whether that was bad luck or a bad model, because nobody ever tested it against anything.
The real cause: forecasts judged on the wrong data
A forecast can only be judged on periods it did not know about when it was made. That sounds obvious, and it is broken constantly — in vendor demos, in internal pilots, and in the way many teams judge their own spreadsheets. The fix is old and unglamorous: a backtest on closed periods, run as if each month were the present, compared with a baseline so simple it is almost insulting.
How forecast evaluations mislead
Testing on data the model has seen. Fitting on twelve months and reporting the error on the same twelve months measures memory, not foresight. The honest number comes only from forecasts made with the data available at the time.
Leakage through restated history. ERP data changes after the fact: late invoices, accrual corrections, reclassifications, credit notes posted into a closed month. A backtest run on today’s version of last March knows things nobody knew last March. Use the entry date — when a document was actually recorded — to rebuild what was known at the time, not just the period it was posted to.
No baseline. An error of a few percent means nothing on its own. Next to “same month last year, adjusted for the trend”, it may be excellent or worse than useless. A model should have to beat a naive baseline before anyone looks at it twice.
Percentages that hide money. A large error on a small product line and a small error on the largest customer are not comparable. Measure error in currency, weighted by what matters to the decision the forecast feeds.
One number for the whole year. Averages hide bias. A forecast that is too optimistic at every quarter-end and too pessimistic at every quarter-start can show a respectable average error and still be useless for cash planning.
What to do instead
- Walk forward through closed periods. Pick a starting month. Give the model only the data up to that month and record its forecast one, three and six months ahead. Step forward a month and repeat. You end up with a table of forecasts made “in the past” to set against what actually happened.
- Always run a baseline beside it. Last year’s same period, a simple moving average, or your current spreadsheet method. The question is not “is the model accurate?” but “is it better than what we would have done anyway, and by how much money?”
- Look at the sign of the error, not just its size. Plot forecast minus actual over time. A cloud around zero is noise. A run on one side is bias, and bias can be corrected.
- Freeze the version. A backtest describes one model, one prompt and one data pipeline. Change any of them and the test has to be re-run. It is one of the practical reasons for running models locally, set out in why financial data should never leave the building: a hosted model that changes underneath you invalidates your evidence without telling you.
- Keep the backtest as documentation. A table of out-of-time errors against a baseline is exactly the accuracy evidence that the article on EU AI rules argues a finance function should keep as a matter of routine.
A backtest should not be a one-off. Every month that closes is a new test case. Comparing each forecast with what happened, automatically, is the second loop in its simplest form: a system that watches its own error and tells you when it starts to drift. The same discipline applies to the commentary around the numbers, as decomposing the variance before narrating it argues.
A test you can run today
You do not need a model to start. Find the forecast your team made three months ago for last month — revenue, cash or margin, whichever matters most. Then build a naive forecast for the same month: the same month last year, scaled by the year-on-year growth you could see at the time.
Compare both with the actual, in money. If the naive forecast was as good or better, your current process is adding effort but not information. Any AI forecast you are offered should have to beat that naive number on your own closed months before it goes anywhere near a board pack — and that applies to the forecasts of ObserBI too.
- backtesting
- forecast accuracy
- model evaluation
- AI CFO